Bible charts: A practical guide to studying Scripture
Bible charts: A practical guide to studying Scripture
You open your Bible to find where a prophet fits in Israel’s history, which Gospel records a particular event, or how the books are arranged—and soon you are turning between pages without a clear answer. Bible charts solve that problem by putting related information into a visual format. A well-made chart can show sequence, connections, categories, and contrasts at a glance.
Charts do not replace reading the biblical text. They give you a framework for reading it with better orientation. You can use them for personal study, Sunday school, sermon preparation, small-group discussion, or a quick refresher when the details of a long passage become difficult to track.
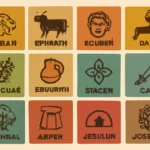
A Bible chart is any organized visual guide that arranges information from Scripture in a way that makes relationships easier to see. Some charts use a timeline, while others use columns, categories, family lines, maps, or side-by-side comparisons. The format depends on the question you are trying to answer.
For example, a Bible timeline chart can place Abraham, Moses, David, the exile, and the ministry of Jesus in historical order. A book chart can show each book’s author, audience, genre, major themes, and approximate setting. A comparison chart can place parallel accounts from Matthew, Mark, Luke, and John alongside one another.
Most useful charts answer one of these questions:
When did an event, person, or book belong in biblical history?
Where did a story happen, and how did geography affect it?
Who was connected to a king, prophet, apostle, tribe, or family?
What is the main purpose or message of a book or passage?
How do related passages compare with or illuminate one another?
Use charts as study aids, not substitutes for context. A chart can show that two events are related, but the biblical passage still determines what those events mean.
How to choose the right Bible chart for your question
Start with the specific problem you are trying to solve. Searching for a general chart without knowing your purpose often produces too much information and makes study harder. A focused question points you toward a useful format.
Define the subject. Decide whether you are studying books, people, events, geography, doctrine, prophecy, or a particular passage.
Choose the relationship to display. Ask whether you need chronology, location, family connection, comparison, repetition, or progression.
Set the scope. A chart covering the whole Bible requires different detail from one focused on the book of Romans or the life of David.
Check the source. Look for charts that identify their references and distinguish clear biblical information from interpretation or reconstruction.
Read the passages alongside the chart. Mark what the text states directly and what the chart infers from several passages.
A chart is most effective when its design matches the question. A timeline is excellent for sequence but poor for showing the structure of an argument. A book-by-book chart is useful for orientation but may not explain how one passage develops an idea across several chapters.
Major types of Bible charts and what each one shows
Bible book charts for structure and purpose
A Bible book chart gives you a quick profile of each book. Common categories include author or traditional attribution, audience, setting, genre, major themes, and key divisions. You might also see the book’s placement in the canon and its relationship to neighboring books.
These charts are especially helpful when you begin a book you have not studied before. Before reading, review the chart to gain a broad sense of the book’s setting. During reading, use it to notice how chapters fit into larger sections. After reading, return to it and revise your understanding based on the text.
Book charts need careful wording. Some authorship questions remain debated, and some dates are estimates rather than certain facts. A responsible chart uses terms such as traditionally attributed to, likely setting, or possible date when the evidence does not justify absolute claims.
Bible timeline charts for historical sequence
Timeline charts arrange people and events in approximate chronological order. They can help you see the broad movement from creation and the patriarchs through the exodus, the monarchy, the exile, the return, and the New Testament period.
Timeline charts are particularly useful for the historical books and the prophets. They can show which kings ruled in Judah or Israel when a prophet ministered, and they can place a prophetic message near the political crisis that shaped its audience. They also help you avoid treating every biblical book as though it follows the order in which it appears in the Bible.
Chronology can become complicated because the Bible does not always give enough information to calculate exact dates. Reigns may overlap, ancient dating systems differ, and scholars interpret some chronological details differently. Good charts signal uncertainty rather than presenting every date with false precision.
Genealogy and family charts for relationships
Genealogy charts trace family connections among individuals, tribes, kings, priests, or major biblical figures. They can make long lists of names easier to follow and clarify how a person relates to an ancestor or successor.
These charts should be read with attention to the purpose of each genealogy. Biblical genealogies may emphasize a particular line, omit generations, organize names thematically, or highlight legal and theological significance. They are not always intended to function as modern civil records with every generation listed.
Use a genealogy chart to locate a person and identify the connection the passage emphasizes. Then read the surrounding verses to see why that family line matters. In the Gospels, for example, genealogical material contributes to each Gospel’s presentation of Jesus, but the chart alone cannot explain the meaning of those presentations.
Geography and map charts for movement and setting
Geographical charts and maps show locations, routes, borders, distances, regions, and changes in political control. They are valuable because place names can feel abstract when you encounter them only in written form.
A map can clarify the route of an exodus, the extent of a kingdom, the setting of a missionary journey, or the distance between a city and a surrounding region. It can also explain why a journey took a particular direction or why a location carried social and religious significance.
Remember that ancient place identification is not always certain. Some sites have disputed locations, and modern borders do not necessarily match ancient political boundaries. Treat map labels as informed aids and consult the biblical passage for the details that the map cannot provide.
Gospel harmony charts for comparing parallel accounts
A Gospel harmony chart places accounts of related events from the four Gospels in corresponding rows or sections. It may include Jesus’ baptism, teachings, miracles, journeys, the final week in Jerusalem, or the resurrection narratives.
This format helps you notice both shared material and distinctive emphases. One Gospel may include a detail that another does not, or the same event may appear in a different literary setting. Differences should not be treated automatically as errors. They may reflect each writer’s purpose, audience, selection of material, and arrangement.
Read a harmony with the individual Gospel in view. The chart can help you compare passages, but it should not flatten each Gospel into a single blended account that removes its distinctive voice.
Theme and word-study charts for tracing ideas
Theme charts collect passages related to subjects such as covenant, kingdom, wisdom, holiness, justice, faith, worship, or exile. Word-study charts may list repeated terms, related concepts, or key occurrences across a book or the wider Bible.
These charts help you follow development and repetition. They can show how a theme appears in different settings and how its emphasis changes from one passage to another. They are useful for preparing a study, but they require careful interpretation.
A repeated English word does not always represent the same Hebrew or Greek word, and the same original-language word can have different meanings in different contexts. Read the whole passage, consider the speaker and audience, and avoid building a doctrine from a word count alone.
Prophecy and fulfillment charts for connected passages
Prophecy charts place prophetic statements beside later passages that Christians understand as related fulfillment, development, or application. They can help readers trace references and identify themes that move across the biblical canon.
Because these charts often involve interpretation, they should clearly distinguish between direct quotation, allusion, thematic connection, and theological conclusion. Not every proposed connection has the same level of agreement among interpreters.
Use cross-references as invitations to read more, not as proof that removes the need for context. Read the original prophetic passage, examine the later passage, and ask how each writer uses the language in its own setting.
How to read a Bible chart without losing the biblical context
Begin by reading the chart title, labels, legend, and notes. These details tell you what the creator intends each column, color, symbol, or line to mean. Without that information, it is easy to mistake a thematic arrangement for a chronological one.
Next, identify the chart’s boundaries. Does it cover the entire Bible, one historical period, one book, or a selected set of passages? A chart may be accurate within its stated scope while still being unsuitable for a broader question.
Then test the chart against the text. Read the cited passages and ask which details are explicit. Mark statements the passage directly makes, conclusions drawn by combining passages, and assumptions supplied by the chart maker.
Pay attention to the following features:
Headings: They often reveal the chart’s main argument or classification system.
Dates: Check whether they are exact, approximate, or disputed.
Arrows and lines: Determine whether they show family, travel, influence, sequence, or literary connection.
Color coding: Find out whether colors represent genre, historical period, authorship, geography, or something else.
References: Use them to verify the information rather than accepting unsupported claims.
Blank spaces: Missing information may reflect limited evidence, not an accidental omission.
Do not force every biblical detail into the chart’s categories. Scripture includes poetry, narrative, law, wisdom, prophecy, letters, and apocalyptic writing. A single visual system will simplify some features and leave others outside its purpose.
How to make your own Bible chart step by step
Creating a chart can be more valuable than simply downloading one because the process requires you to sort information, compare passages, and identify relationships. Begin with a narrow assignment. “All biblical themes” is too broad for a useful first chart, while “the kings of Judah and the prophets who served during their reigns” gives you a manageable question.
Define the chart’s purpose and audience
Write one sentence describing what the chart should help someone understand. For example: “This chart shows the order of Paul’s major missionary movements and the letters associated with them.” A clear purpose prevents unrelated information from crowding the page.
Consider who will use it. A chart for children may need fewer categories and clearer labels. A personal study chart can contain detailed references and questions. A group handout should be readable from a distance and simple enough to support conversation.
Gather information from the biblical text first
Collect references before filling in conclusions. Record names, places, dates, relationships, repeated terms, or events exactly as the passages present them. If you use a study Bible, commentary, or reference work, keep those observations separate from your initial notes.
This approach helps you recognize the difference between observation and interpretation. It also makes it easier to revise the chart if a later passage adds an important qualification.
Choose columns that answer the central question
Every column should earn its place. For a prophet chart, useful columns might include prophet, audience, setting, rulers during ministry, major concern, and biblical references. For a book chart, you might use book, genre, setting, main section, central concern, and related books.
A crowded chart is difficult to read and usually tries to answer too many questions at once. If you need more information, create a second chart rather than shrinking the text or adding long paragraphs to every cell.
Mark uncertainty honestly
Use phrases such as approximately, possibly, traditionally understood, or the text does not specify when appropriate. You can also add a short note explaining that dates or identifications are debated.
Honest uncertainty strengthens a chart. It tells readers where the Bible speaks clearly and where interpretation requires caution. Avoid using visual precision—such as exact lines or tightly spaced dates—to imply certainty that the evidence does not support.
Review the chart for clarity and accuracy
Read the chart from the perspective of someone who has not made it. Can that person understand the abbreviations, symbols, and sequence? Are references easy to locate? Does the chart make a claim that the cited passage does not actually support?
Ask another reader to explain what they think the chart shows. Their response can reveal confusing labels or unintended conclusions. Then revise the chart until its design supports the question without adding unnecessary complexity.
Ways to use Bible charts in personal and group study
Before reading a book, use a chart to establish orientation. Identify its broad setting, literary form, and major divisions. Keep the chart nearby, but allow the passage to lead your observations rather than searching only for details that confirm the chart.
During study, add your own notes. You might record repeated words, changes in location, shifts in speakers, or links to earlier passages. A chart becomes more useful when it reflects your reading and includes the questions that the text raises for you.
For group study, give participants a simple chart before discussion. Ask them to fill in missing information from the passage or arrange events in order. This turns the chart into an active study tool rather than a handout that people glance at and set aside.
Charts can also support teaching in several practical ways:
Use a timeline to establish the setting before studying a prophet or historical book.
Use a character chart to compare decisions, relationships, conflicts, and changes across a narrative.
Use a structure chart to identify repeated sections, contrasts, or movements within a book.
Use a cross-reference chart to guide readers from a central passage to related texts.
Use a question chart with columns for observation, interpretation, and application.
A practical study rhythm: Read the passage first, consult the chart second, then return to the passage to test what the chart helped you notice.
Common mistakes when using Bible charts
The most common mistake is treating a visual aid as if it were the biblical text itself. Charts compress information, and compression always leaves something out. A timeline may omit literary structure; a genealogy may simplify relationships; a theme chart may select only certain passages.
Another mistake is assuming that chronological order equals literary order. The Bible often arranges material for theological, rhetorical, or narrative purposes. A chart can show when events may have happened, but it cannot by itself explain why a writer placed them where they appear.
Readers also need to distinguish biblical certainty from scholarly reconstruction. A chart may assign a date, identify an author, or connect two locations based on reasonable evidence, but that does not make the claim equally certain with information directly stated in Scripture.
Avoid using charts to support isolated proof texts. If a chart gathers verses under a theme, read each verse in its paragraph, chapter, and book. A passage about faith, kingdom, sacrifice, or wisdom may carry a particular meaning in context that a topic list cannot preserve.
Finally, do not let an attractive design substitute for reliable content. Clear colors and neat lines can make weak information look authoritative. Check references, read explanatory notes, and compare significant claims with more than one trusted resource when the subject is disputed.
What makes a Bible chart reliable and useful
A reliable chart states its purpose and scope clearly. It identifies whether it is presenting direct biblical information, a traditional interpretation, an academic proposal, or a combination of these. It also provides references that allow you to verify the entries.
Good charts use consistent categories. If one row lists a person’s birthplace while another lists a major event, the comparison becomes misleading. Consistent labels make patterns easier to see and reduce confusion.
Useful charts are selective without being deceptive. They simplify enough to remain readable, but they do not hide important qualifications. Notes about disputed dates, alternate identifications, or differences between Gospel accounts can prevent readers from drawing conclusions the chart cannot support.
Look for these qualities when evaluating a chart:
Transparent sources: References or explanatory notes are included.
Clear scope: The chart explains the period, books, people, or themes it covers.
Careful wording: Certainty and interpretation are not confused.
Readable design: Labels, symbols, and connections are easy to follow.
Respect for context: Passages are not reduced to disconnected phrases.
Useful restraint: The chart does not overload the reader with unrelated data.
Digital, printable, and handwritten Bible charts
Digital charts are convenient when you need to search, enlarge, reorganize, or connect information. A spreadsheet works well for lists of books, rulers, prophets, and references. A mind-mapping tool can show relationships, while a simple document may be best for a chart you plan to print.
Printable charts are useful for repeated reading and group discussion. Choose a format with enough space for notes and a font size that remains readable on paper. If a chart must be folded or reduced to fit a page, simplify it before printing rather than making every label too small.
Handwritten charts can be especially effective for learning. Writing the names, references, and relationships slows you down enough to notice patterns. You do not need artistic skill; a clear page with headings, arrows, and short notes is more useful than a decorative chart that is difficult to interpret.
Whichever format you choose, keep the original references attached to the chart. A chart separated from its sources becomes harder to verify and easier to misunderstand over time.
Using Bible charts to build a stronger study habit
Choose one chart that matches your current reading plan instead of collecting many unrelated resources. If you are reading Acts, a map and journey chart may help more than a complete Old Testament timeline. If you are studying a short letter, a structure chart and repeated-theme list may provide better support.
Review the chart at three points: before reading to gain orientation, during reading to track relationships, and after reading to correct or expand your notes. This repeated use turns the chart into part of your study method rather than a one-time reference.
Keep a record of open questions. You might note an uncertain date, a disputed location, or a relationship that requires further research. Returning to these questions later encourages careful study and protects you from accepting a neat visual answer simply because it is easy to remember.
The best Bible charts make Scripture easier to see without making it seem simpler than it is. They help you locate books, follow people, understand settings, compare accounts, and trace themes. Used with close reading, prayerful reflection, and attention to context, they become practical tools for a more organized and informed study of the Bible.
Frequently asked questions
Are Bible charts the same as a Bible study?
No. A chart organizes information, while a Bible study examines the meaning of a passage in its literary, historical, and theological context. Charts are helpful supports for study, but they cannot replace reading the surrounding verses, considering the author’s purpose, or comparing interpretations. Use a chart to orient yourself and generate questions, then let the biblical text guide your conclusions.
Which Bible chart should I use first?
A book chart is often the best starting point because it gives you the setting, genre, major themes, and structure of the book you are reading. If your main difficulty is historical order, choose a timeline instead. For a narrative, a character or location chart may be more useful than a general reference chart.
How can I tell whether a Bible timeline is accurate?
Check whether the timeline labels dates as exact or approximate, identifies its sources, and explains disputed points. Compare its claims with the biblical passages and a reliable reference work. Ancient chronology can involve overlapping reigns, different dating systems, and incomplete information, so a trustworthy timeline should acknowledge uncertainty rather than present every date as definitive.
Can children use Bible charts?
Yes. Children often benefit from simple charts that show a few major people, places, books, or events. Use large labels, clear categories, and limited information. Ask children to match names with events, arrange story cards in order, or trace a journey on a map. Keep the activity connected to reading the actual passage rather than memorizing disconnected facts.










Leave a Reply